Canada: Diversity within Diversity
Canada is a land of cultural diversity with a multitude of visible minority groups. More often than not, these groups will migrate to areas with higher concentrations of individuals and families that share their cultural values. For marketers, it is important to strategically understand their distinct cultural trends and target cultural demographics appropriately.
In 2016, 20.8 percent of Canadians identified as members of a visible minority group, accounting for a large population of 7.4 million. Cities like Toronto and Vancouver are nearing a minority majority population, while in cities like Markham, Brampton, Richmond, Burnaby, Richmond Hill and Surrey, minority populations are already the majority. Many neighbourhoods have accommodated these new immigrants by attracting niches within niches of distinct cultural groups.
Businesses are responding accordingly. Last August, Sobeys opened its first South Asian-focused grocery store in Brampton, Ontario. This store is named Chalo! FreshCo and translates to “Let’s go to FreshCo” in several South Asian languages. While visiting this grocery store this weekend, I was curious about how businesses incorporate cultural data to execute effective marketing decisions. As a Client Advocate intern at Environics Analytics (EA), I try to find meaningful trends with data and develop target audiences that can be understood in greater detail to inform corporate decision-making.
During my trip to Chalo! FreshCo, I was struck by how the company had strategically defined its culturally distinct audience. The store attracted a large South Asian clientele, and the aesthetics reflected South Asian cultures. This was apparent through design elements that incorporated bright colours, large bulk bins with spices, lentils and nuts, along with little carts within the store that represented Indian street vendors. The new location worked to provide a unique and convenient experience as a one-stop-shop for shoppers to purchase both South Asian and Canadian groceries. As a first-generation Canadian, I am very frequently placed in a middle-ground between ideals of cultural incorporation and assimilation; this leaves me wondering what specific levels of acculturation this location aimed to target. Does it want to capture more traditional groups with lower rates of cultural assimilation or younger, more assimilated shoppers?

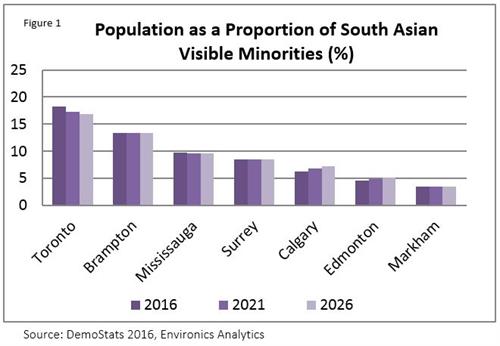
EA offers many databases and software products that can locate specific audiences based on demographics. DemoStats and EA’s cultural database, AccultuRates, provide demographic variables to identify the large concentrations of South Asian and Chinese visible minorities within the Canadian population. According to DemoStats 2016, South Asian and Chinese visible minority groups are the two largest in Canada. Figure 1 shows that the top seven cities that are home to South Asians in Canada: Toronto, Brampton, Mississauga, Surrey, Calgary, Edmonton and Markham.
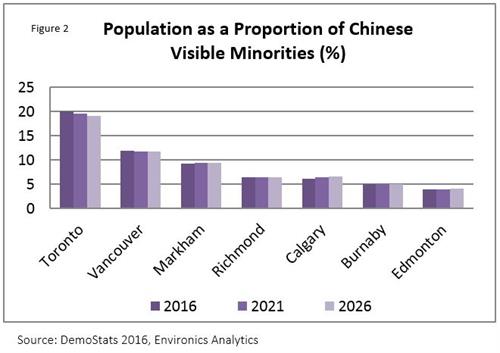
Meanwhile, the highest concentrations of Chinese Canadians are found in Toronto, Vancouver, Markham, Richmond, Calgary, Burnaby and Edmonton (Figure 2). Based on these patterns, I felt that it was important to identify growth rates for the next five and ten years to forecast whether these visible minority populations would increase or decrease. The 2021 and 2026 projections from DemoStats are important to consider, especially for a business whose survival depends on the concentration of culturally diverse customers within its trade area.

AccultuRates categorizes South Asian and Chinese Canadians into six distinct levels of acculturation. Digging deeper allows analysts to focus on the niche demographics of diversity within the diversity.
The acculturation groups are defined as follows:
- Traditionalists (12.1 percent of the South Asian population and 11.1 percent of the Chinese population)
Born in India/China and having immigrated more than 15 years ago, they tend to speak their mother tongue at home and identify with their homeland. - Transitions (20.8 percent of the South Asian population and 19.8 percent of the Chinese population)
Born in either India/Pakistan/Sri Lanka or China/Hong Kong, and having immigrated within the past 15 years, they tend to speak their mother tongue at home and identify with their homeland. - Newcomers (26.2 percent of the South Asian population and 29.6 percent of the Chinese population)
Born in India/Pakistan or China/Hong Kong, and having immigrated within the past 15 years, they tend to speak their mother tongue at home and identify with their homeland. - Bi-Cultural (11.5 percent of the South Asian population and 14.6 percent of the Chinese population)
Born in India/China and having immigrated within the past 15 years, they tend to speak their mother tongue or English at home, and identify with their homeland and Canada. - Fusion (14.2 percent of the South Asian population and 10.2 percent of the Chinese population)
Born in Canada and having immigrated more than 15 years ago, they tend to speak English at home. While South Asians identify with their homeland and Canada, Chinese populations are more likely to identify with Canada. - NextGen (14.5 percent of the South Asian population and 14.7 percent of the Chinese population)
Born in Canada, they tend to speak English at home and identify with Canada and their homeland.

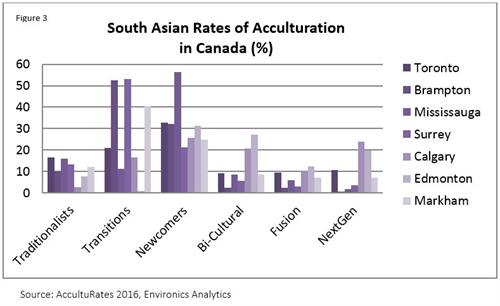
Consider how these classifications play out in Brampton, home of the new Sobeys. According to AccultuRates 2016, Brampton has a strikingly large visible minority population (71.5 percent), of which a large percent is South Asian (42.2 percent)—eight times the national average. This demographic reality supports the selection of Brampton as an appropriate location for Chalo! FreshCo. The data also show that a large concentration of South Asians in Brampton are classified by AccultuRates as "Transitions"—more than 50 percent of residents (Figure 3). They are immigrants who are likely to own and rent newer apartments and condominiums in South Asian neighbourhoods. They have lower levels of acculturation and still identify with their homeland—and are likely attracted to cultural hubs.
Figure 3 also illustrates that a large representation of South Asians in Brampton are Newcomers (32.3 percent). This population also identifies with their homeland and is likely to appreciate a grocery store with all the foods and products of their homeland. By contrast, groups with higher levels of acculturation tend to identify more with Canadian culture and may be less inclined to visit a culturally-focused store. Based on Figure 3, Brampton is home to fewer consumers at these higher rates of acculturation in Bi-Cultural, Fusion and NextGen groups. These South Asian Canadians are well assimilated in Canadian culture and are less likely to engage with hubs of cultural promotion. The bottom line: Sobeys picked the right location for Chalo! FreshCo: a growing, culturally-diverse community where residents still exhibit strong ties to their South Asian tradition.

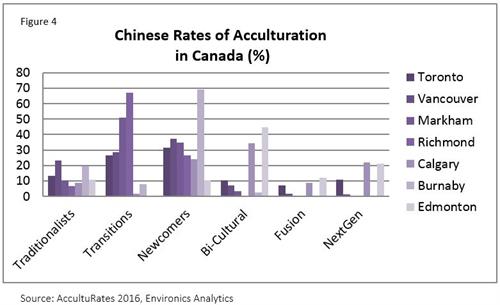
By optimizing EAs DemoStats’ population projections, growth rates can be quantified by neighbourhood to calculate future acculturation levels that reflect future market sizes. This approach to projecting growth also works in South Asian and Chinese communities that have lower rates of acculturation, such as the presence of Bi-Cultural and NextGen groups in Calgary and Edmonton. Figure 4 shows that, similar to South Asians, Chinese populations migrate to communities with people who share their culture and customs. In cities like Toronto, Vancouver, Markham, Burnaby and Richmond, a Chinese-focused grocery store (or any Chinese-focused store, for that matter) could be quite successful. This observation is also based on the large concentration of Chinese residents within the Transitions and Newcomers groups who identify with their homeland.
In Burnaby, B.C., Newcomers account for 69.1 percent of the Chinese population while only 0.3 percent of Chinese are classified Fusion and NextGen. Marketers who understand this acculturation divide can better engage the appropriate subcultures with their messaging and language. Similar customer insights can help marketers connect with Bi-Cultural and NextGen Chinese residents in Calgary and Edmonton. Channels of marketing to these populations may differ between cities, however, based on marketplace preferences. But EA’s ENVISION5 mapping tool can further locate areas of demographic concentrations based on specific levels of acculturation.
Culturally-focused grocery stores like Chalo! FreshCo are not alone. Chains like Save-On-Foods by Overwaitea Food Group, Marché Adonis (majority owned) by Metro and T&T by Loblaws—all offer culturally diverse outlets. The trend of specializing grocery offerings to concentrations of visible minorities is one that is innovative, accommodating and reflects both current and projected demographic trends in Canada.
One Save-On-Foods, located in Surrey, has a unique position within the marketplace: it offers groceries that come from around the world, including items from the UK, Germany, Sweden, India, Philippines and China. Marché Adonis, located in Montreal and Mississauga, focuses on Mediterranean groceries and caters to the concentration of visible minority populations within those cities. T&T does the same, as it caters to Chinese populations in seven different geographic regions within Ontario. Clearly, data on visible minority populations can assist businesses in selecting optimal site locations, merchandising and marketing to the appropriate audiences. Understanding the different levels of acculturation can provide meaningful insights on the types and tastes of visible minorities--and should be reflected in corporate strategies for success.
###


